
by Nick CawleySenior Strategist
GOLD (XAU/USD PRICE AND ANALYSIS
- Israel/Iran conflict – The lull before the storm?
- Gold consolidates ahead of a potential breakout.
Israel is still likely to respond to Saturday’s drone and missile attack by Iran, despite the latest diplomatic efforts by other countries to try and calm the situation in the Middle East. After talks with the UK and Germany yesterday, Israel’s Prime Minister Benjamin Netanyahu thanked both for their advice but warned of retaliatory action ahead.
“They have all sorts of suggestions and advice. I appreciate that. But I want to make it clear – we will make our own decisions, and the state of Israel will do everything necessary to defend itself.”
According to a report in The Daily Telegraph, Israel is unlikely to carry out retaliatory action before the end of Passover (April 30).
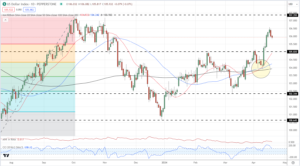
With a potential lull in Middle East tensions now seen until the end of the month, gold will need a new driver to keep it at its current elevated levels. The US dollar backed off from its recent multi-month highs overnight, helping the precious metal consolidate. The US dollar has rallied hard since early March, and this move accelerated last Wednesday after data showed that US inflation is refusing to move towards the central bank’s target. Technical support from all three simple moving averages on the daily chart is set to keep the US dollar higher for longer.
US DOLLAR INDEX – APRIL 18TH, 2024
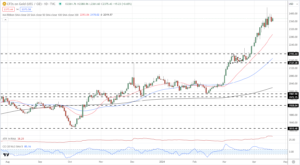
The price of gold remains within touching distance of its recent all-time high at $2,431.8/oz. and if the situation in the Middle East escalates, this high is likely to be breached. Gold is moving out of heavily overbought territory, while the recent multi-month ATR is starting to turn lower. The precious metal may see a period of consolidation over the coming days before the situation in the Middle East dictates the next move.
GOLD DAILY PRICE CHART – APRIL 18TH, 2024
Retail trader data shows 50.75% of traders are net-long with the ratio of traders long to short at 1.03 to 1.The number of trader’s net long is 2.08% lower than yesterday and 2.19% lower than last week, while the number of trader’s net short is 3.89% lower than yesterday and 8.03% lower than last week.